|
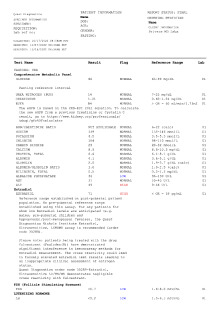
Comprehensive Metabolic Panel
 Insights
|
|
Urea Nitrogen (BUN)
|

|
high
|
|
|
|
Low
|
Desirable 7 – 25
|
High
|
|
|
|
|
|
|
Creatinine
|
|
|
high
|
|
|
|
Low
|
Desirable 0.60 – 1.26
|
High
|
|
|
|
|
|
|
AST
|

|
good
|
|
|
|
Low
|
Desirable 10 – 40
|
High
|
|
|
|
|
|
|
Glucose
|
|
|
good
|
|
|
|
Low
|
Desirable 65 – 99
|
High
|
|
|
|
|
|
Note: Fasting reference interval
|
|
|
EGFR
|
|
|
good
|
|
|
|
|
BUN/Creatinine Ratio
|
|
|
good
|
|
|
|
Low
|
Desirable 6 – 22
|
High
|
|
|
|
|
|
|
Sodium
|
|
|
good
|
|
|
|
Low
|
Desirable 135 – 146
|
High
|
|
|
|
|
|
|
Potassium
|
|
|
good
|
|
|
|
Low
|
Desirable 3.5 – 5.3
|
High
|
|
|
|
|
|
|
Chloride
|
|
|
good
|
|
|
|
Low
|
Desirable 98 – 110
|
High
|
|
|
|
|
|
|
Carbon Dioxide
|
|
|
good
|
|
|
|
Low
|
Desirable 20 – 32
|
High
|
|
|
|
|
|
|
Calcium
|
|
|
good
|
|
|
|
Low
|
Desirable 8.6 – 10.3
|
High
|
|
|
|
|
|
|
Protein, Total
|
|
|
good
|
|
|
|
Low
|
Desirable 6.1 – 8.1
|
High
|
|
|
|
|
|
|
Albumin
|
|
|
good
|
|
|
|
Low
|
Desirable 3.6 – 5.1
|
High
|
|
|
|
|
|
|
Globulin
|
|
|
good
|
|
|
|
Low
|
Desirable 1.9 – 3.7
|
High
|
|
|
|
|
|
|
Albumin/Globulin Ratio
|
|
|
good
|
|
|
|
Low
|
Desirable 1.0 – 2.5
|
High
|
|
|
|
|
|
|
Bilirubin, Total
|
|
|
good
|
|
|
|
Low
|
Desirable 0.2 – 1.2
|
High
|
|
|
|
|
|
|
Alkaline Phosphatase
|
|
|
good
|
|
|
|
Low
|
Desirable 36 – 130
|
High
|
|
|
|
|
|
|
ALT
|
|
|
good
|
|
|
|
Low
|
Desirable 9 – 46
|
High
|
|
|
|
|
|
|
Testosterone
Insights
|
|
Testosterone, Total, MS
|
|
|
good
|
|
|
|
Low
|
Desirable 250 – 1100
|
High
|
|
|
|
|
|
Note: For additional information, please refer to
http://education.questdiagnostics.com/faq/
TotalTestosteroneLCMSMSFAQ165
(This link is being provided for informational/
educational purposes only.)
This test was developed and its analytical performance
characteristics have been determined by Quest
Diagnostics Nichols Institute Chantilly, VA. It has
not been cleared or approved by the U.S. Food and Drug
Administration. This assay has been validated pursuant
to the CLIA regulations and is used for clinical
purposes.
|
|
|
Testosterone, Free
|
|
|
good
|
|
|
|
Low
|
Desirable 35.0 – 155.0
|
High
|
|
|
|
|
|
Note: This test was developed and its analytical performance
characteristics have been determined by Quest
Diagnostics Nichols Institute Chantilly, VA. It has
not been cleared or approved by the U.S. Food and Drug
Administration. This assay has been validated pursuant
to the CLIA regulations and is used for clinical
purposes.
|
|
|
Estradiol
Insights
|
|
Estradiol, Ultrasensitive, LC/MS
|
|
|
good
|
|
|
|
Note: This test was developed and its analytical performance
characteristics have been determined by Quest Diagnostics
Nichols Institute San Juan Capistrano. It has not been
cleared or approved by FDA. This assay has been validated
pursuant to the CLIA regulations and is used for clinical
purposes.
|
|
|
IGF 1
Insights
|
|
IGF 1, LC/MS
|
|
|
good
|
|
|
|
Low
|
Desirable 83 – 456
|
High
|
|
|
|
|
|
|
Z Score (Female)
|
|
|
good
|
|
|
|
Note: This test was developed and its analytical performance
characteristics have been determined by Quest Diagnostics
Nichols Institute San Juan Capistrano. It has not been
cleared or approved by FDA. This assay has been validated
pursuant to the CLIA regulations and is used for clinical
purposes.
|
|
|
PSA
Insights
|
|
PSA, Total
|
|
|
good
|
|
|
|
Note: The total PSA value from this assay system is
standardized against the WHO standard. The test
result will be approximately 20% lower when compared
to the equimolar-standardized total PSA (Beckman
Coulter). Comparison of serial PSA results should be
interpreted with this fact in mind.
This test was performed using the Siemens
chemiluminescent method. Values obtained from
different assay methods cannot be used
interchangeably. PSA levels, regardless of
value, should not be interpreted as absolute
evidence of the presence or absence of disease.
|
|
|
CBC (Includes DIFF/PLT)
Insights
|
|
White Blood Cell Count
|
|
|
good
|
|
|
|
Low
|
Desirable 3.8 – 10.8
|
High
|
|
|
|
|
|
|
Red Blood Cell Count
|
|
|
good
|
|
|
|
Low
|
Desirable 3.80 – 5.10
|
High
|
|
|
|
|
|
|
Hemoglobin
|
|
|
good
|
|
|
|
Low
|
Desirable 11.7 – 15.5
|
High
|
|
|
|
|
|
|
Hematocrit
|
|
|
good
|
|
|
|
Low
|
Desirable 35.0 – 45.0
|
High
|
|
|
|
|
|
|
MCV
|
|
|
good
|
|
|
|
Low
|
Desirable 80.0 – 100.0
|
High
|
|
|
|
|
|
|
MCH
|
|
|
good
|
|
|
|
Low
|
Desirable 27.0 – 33.0
|
High
|
|
|
|
|
|
|
MCHC
|
|
|
good
|
|
|
|
Low
|
Desirable 32.0 – 36.0
|
High
|
|
|
|
|
|
|
RDW
|
|
|
good
|
|
|
|
Low
|
Desirable 11.0 – 15.0
|
High
|
|
|
|
|
|
|
Platelet Count
|
|
|
good
|
|
|
|
Low
|
Desirable 140 – 400
|
High
|
|
|
|
|
|
|
MPV
|
|
|
good
|
|
|
|
Low
|
Desirable 7.5 – 12.5
|
High
|
|
|
|
|
|
|
Absolute Neutrophils
|
|
|
good
|
|
|
|
Low
|
Desirable 1500 – 7800
|
High
|
|
|
|
|
|
|
Absolute Lymphocytes
|
|
|
good
|
|
|
|
Low
|
Desirable 850 – 3900
|
High
|
|
|
|
|
|
|
Absolute Monocytes
|
|
|
good
|
|
|
|
Low
|
Desirable 200 – 950
|
High
|
|
|
|
|
|
|
Absolute Eosinophils
|
|
|
good
|
|
|
|
Low
|
Desirable 15 – 500
|
High
|
|
|
|
|
|
|
Absolute Basophils
|
|
|
good
|
|
|
|
|
Neutrophils
|
|
|
good
|
|
|
|
|
Lymphocytes
|
|
|
good
|
|
|
|
|
Monocytes
|
|
|
good
|
|
|
|
|
Eosinophils
|
|
|
good
|
|
|
|
|
Basophils
|
|
|
good
|
|
|
|
|
FSH And LH
Insights
|
|
LH
|
|
|
good
|
|
|
|
Note: Reference Range
Follicular Phase 1.9-12.5
Mid-Cycle Peak 8.7-76.3
Luteal Phase 0.5-16.9
Postmenopausal 10.0-54.7
|
|
|
FSH
|
|
|
good
|
|
|
|
Note: Reference Range
Follicular Phase 2.5-10.2
Mid-cycle Peak 3.1-17.7
Luteal Phase 1.5- 9.1
Postmenopausal 23.0-116.3
|
|
|
Thyroid Panel With TSH
Insights
|
|
T4 (Thyroxine), Total
|
|
|
good
|
|
|
|
Low
|
Desirable 5.1 – 11.9
|
High
|
|
|
|
|
|
|
Free T4 Index (T7)
|
|
|
good
|
|
|
|
Low
|
Desirable 1.4 – 3.8
|
High
|
|
|
|
|
|
|
T3 Uptake
|
|
|
good
|
|
|
|
Low
|
Desirable 22 – 35
|
High
|
|
|
|
|
|
|
TSH
|
|
|
good
|
|
|
|
Note: Reference Range
> or = 20 Years 0.40-4.50
Pregnancy Ranges
First trimester 0.26-2.66
Second trimester 0.55-2.73
Third trimester 0.43-2.91
|
|
|
Lipid Panel
Insights
|
|
HDL Cholesterol
|
|
|
good
|
|
|
|
|
Triglycerides
|
|
|
good
|
|
|
|
|
CHOL/HDLC Ratio
|
|
|
good
|
|
|
|
|
Non HDL Cholesterol
|
|
|
good
|
|
|
|
Note: For patients with diabetes plus 1 major ASCVD risk
factor, treating to a non-HDL-C goal of <100 mg/dL
(LDL-C of <70 mg/dL) is considered a therapeutic
option.
|
|
|
Cholesterol, Total
|
|
|
good
|
|
|
|
|
LDL-Cholesterol
|
|
|
good
|
|
|
|
Note: Reference range: <100
Desirable range <100 mg/dL for primary prevention;
<70 mg/dL for patients with CHD or diabetic patients
with > or = 2 CHD risk factors.
LDL-C is now calculated using the Martin-Hopkins
calculation, which is a validated novel method providing
better accuracy than the Friedewald equation in the
estimation of LDL-C.
Martin SS et al. JAMA. 2013;310(19): 2061-2068
(http://education.QuestDiagnostics.com/faq/FAQ164)
|
|